Executive Summary
The most appropriate friction reducer tested using a synthetic major operator’s Delaware water was Alpha FR 1. AET modified 3 products to see if an optimized solution would outperform in the Delaware water source, but it did not. Further testing of these optimized solutions in the Midland water source may indicate that Alpha FR 1-modified would be the most appropriate source.
Test Procedures
Synthetic Brine Composition
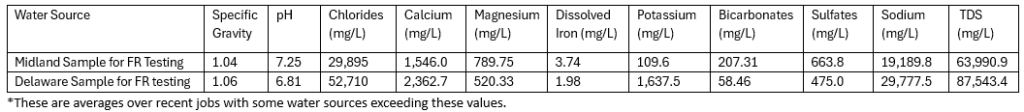
A synthetic water makeup matching the customer’s correspondence was generated matching Table 1 below for the Delaware water source.
Table 1. Major operator water quality averages from recent jobs, supplied by a major operator.
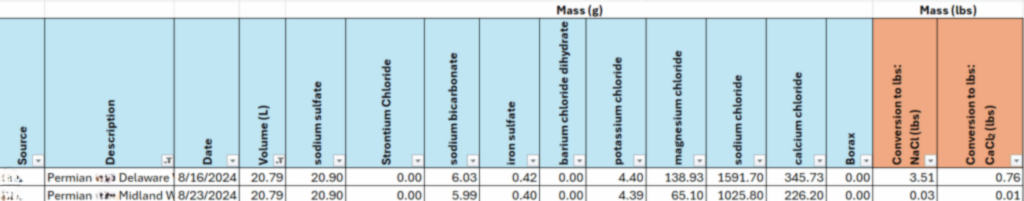
Exact masses below (g) were added to 5.5 gal of Houston tap water as follows, and allowed to dissolve and flow through a Chandler 7700 friction loop for 10 minutes at a rate of 2 gpm, when the solution appeared reasonably homogenous:
Table 1. Exact salt mass (g) used to generate synthetic makeup water.
Flow Loop Tests
A Chandler 7700 flow loop equipped with both a ¾” and ½” 40 ft pipe with pressure sensors was used to determine friction reduction during pumping. A flow regime which incorporates several rate changes was included in the testing to determine shear sensitivity of the individual products at different rates. Below is an image of the flow loop used in testing, and a screenshot of the rate schedule.

Figure 1. Rate schedule used for standard flow loop testing.
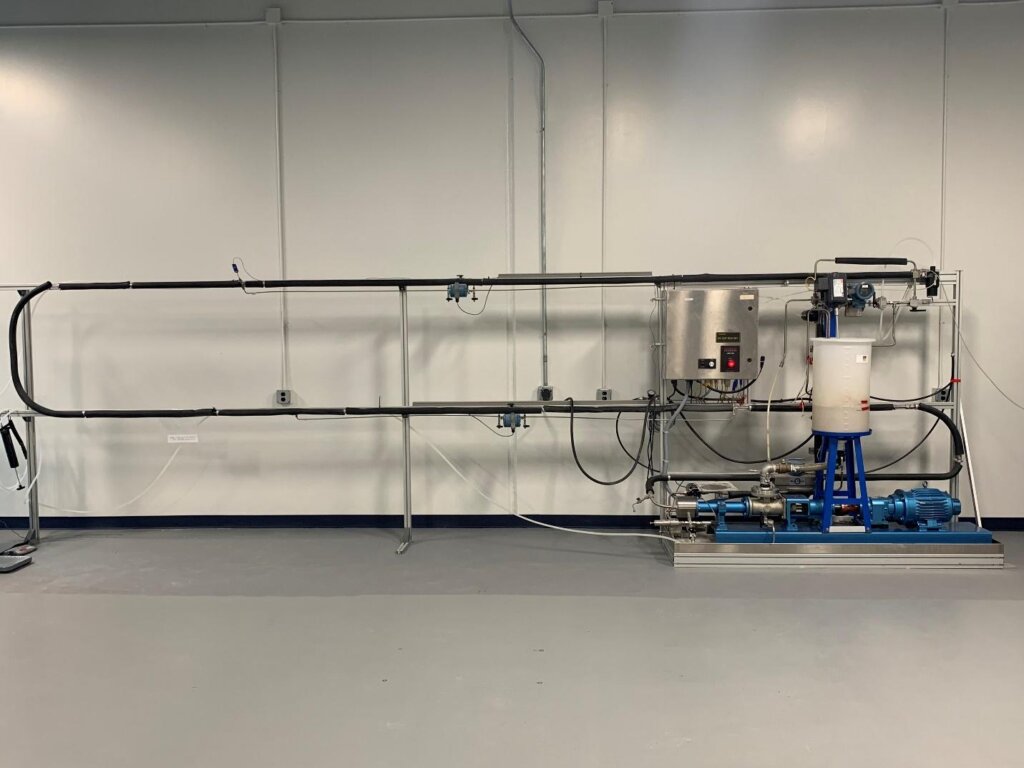
Figure 2. Flow loop used for this testing.
For each individual test, the schedule is started and allowed to achieve a steady base rate without friction reducer product and the appropriate amount of friction reducer product is added to the reservoir at once via syringe, fully dosed in less than 3 seconds. The change in pressure is monitored electronically over the course of the test and calculated to % friction reduction.
Cleaning the flow loop after and between tests is done by combinations of serial dilution and draining followed by the use of sodium perborate (between 5 and 10 grams per test) to oxidatively cleave any residual friction reducer, a process taking around an hour per test.
Dynamic Viscosity Testing
Viscosity testing was conducted with a Grace M3600 viscometer equipped with an R1B1 bob. A timer was started followed by samples added at appropriate dosages (0.4 mL for 2 gpt) in 200 mL of synthetic water (produced from the recipe above in 2L batches). These were blended at approximately 800 rpm for 15 seconds and then measured under continuous shear of 511 sec⁻¹ on the viscometer with timed measurements as indicated in the results.
Test Results
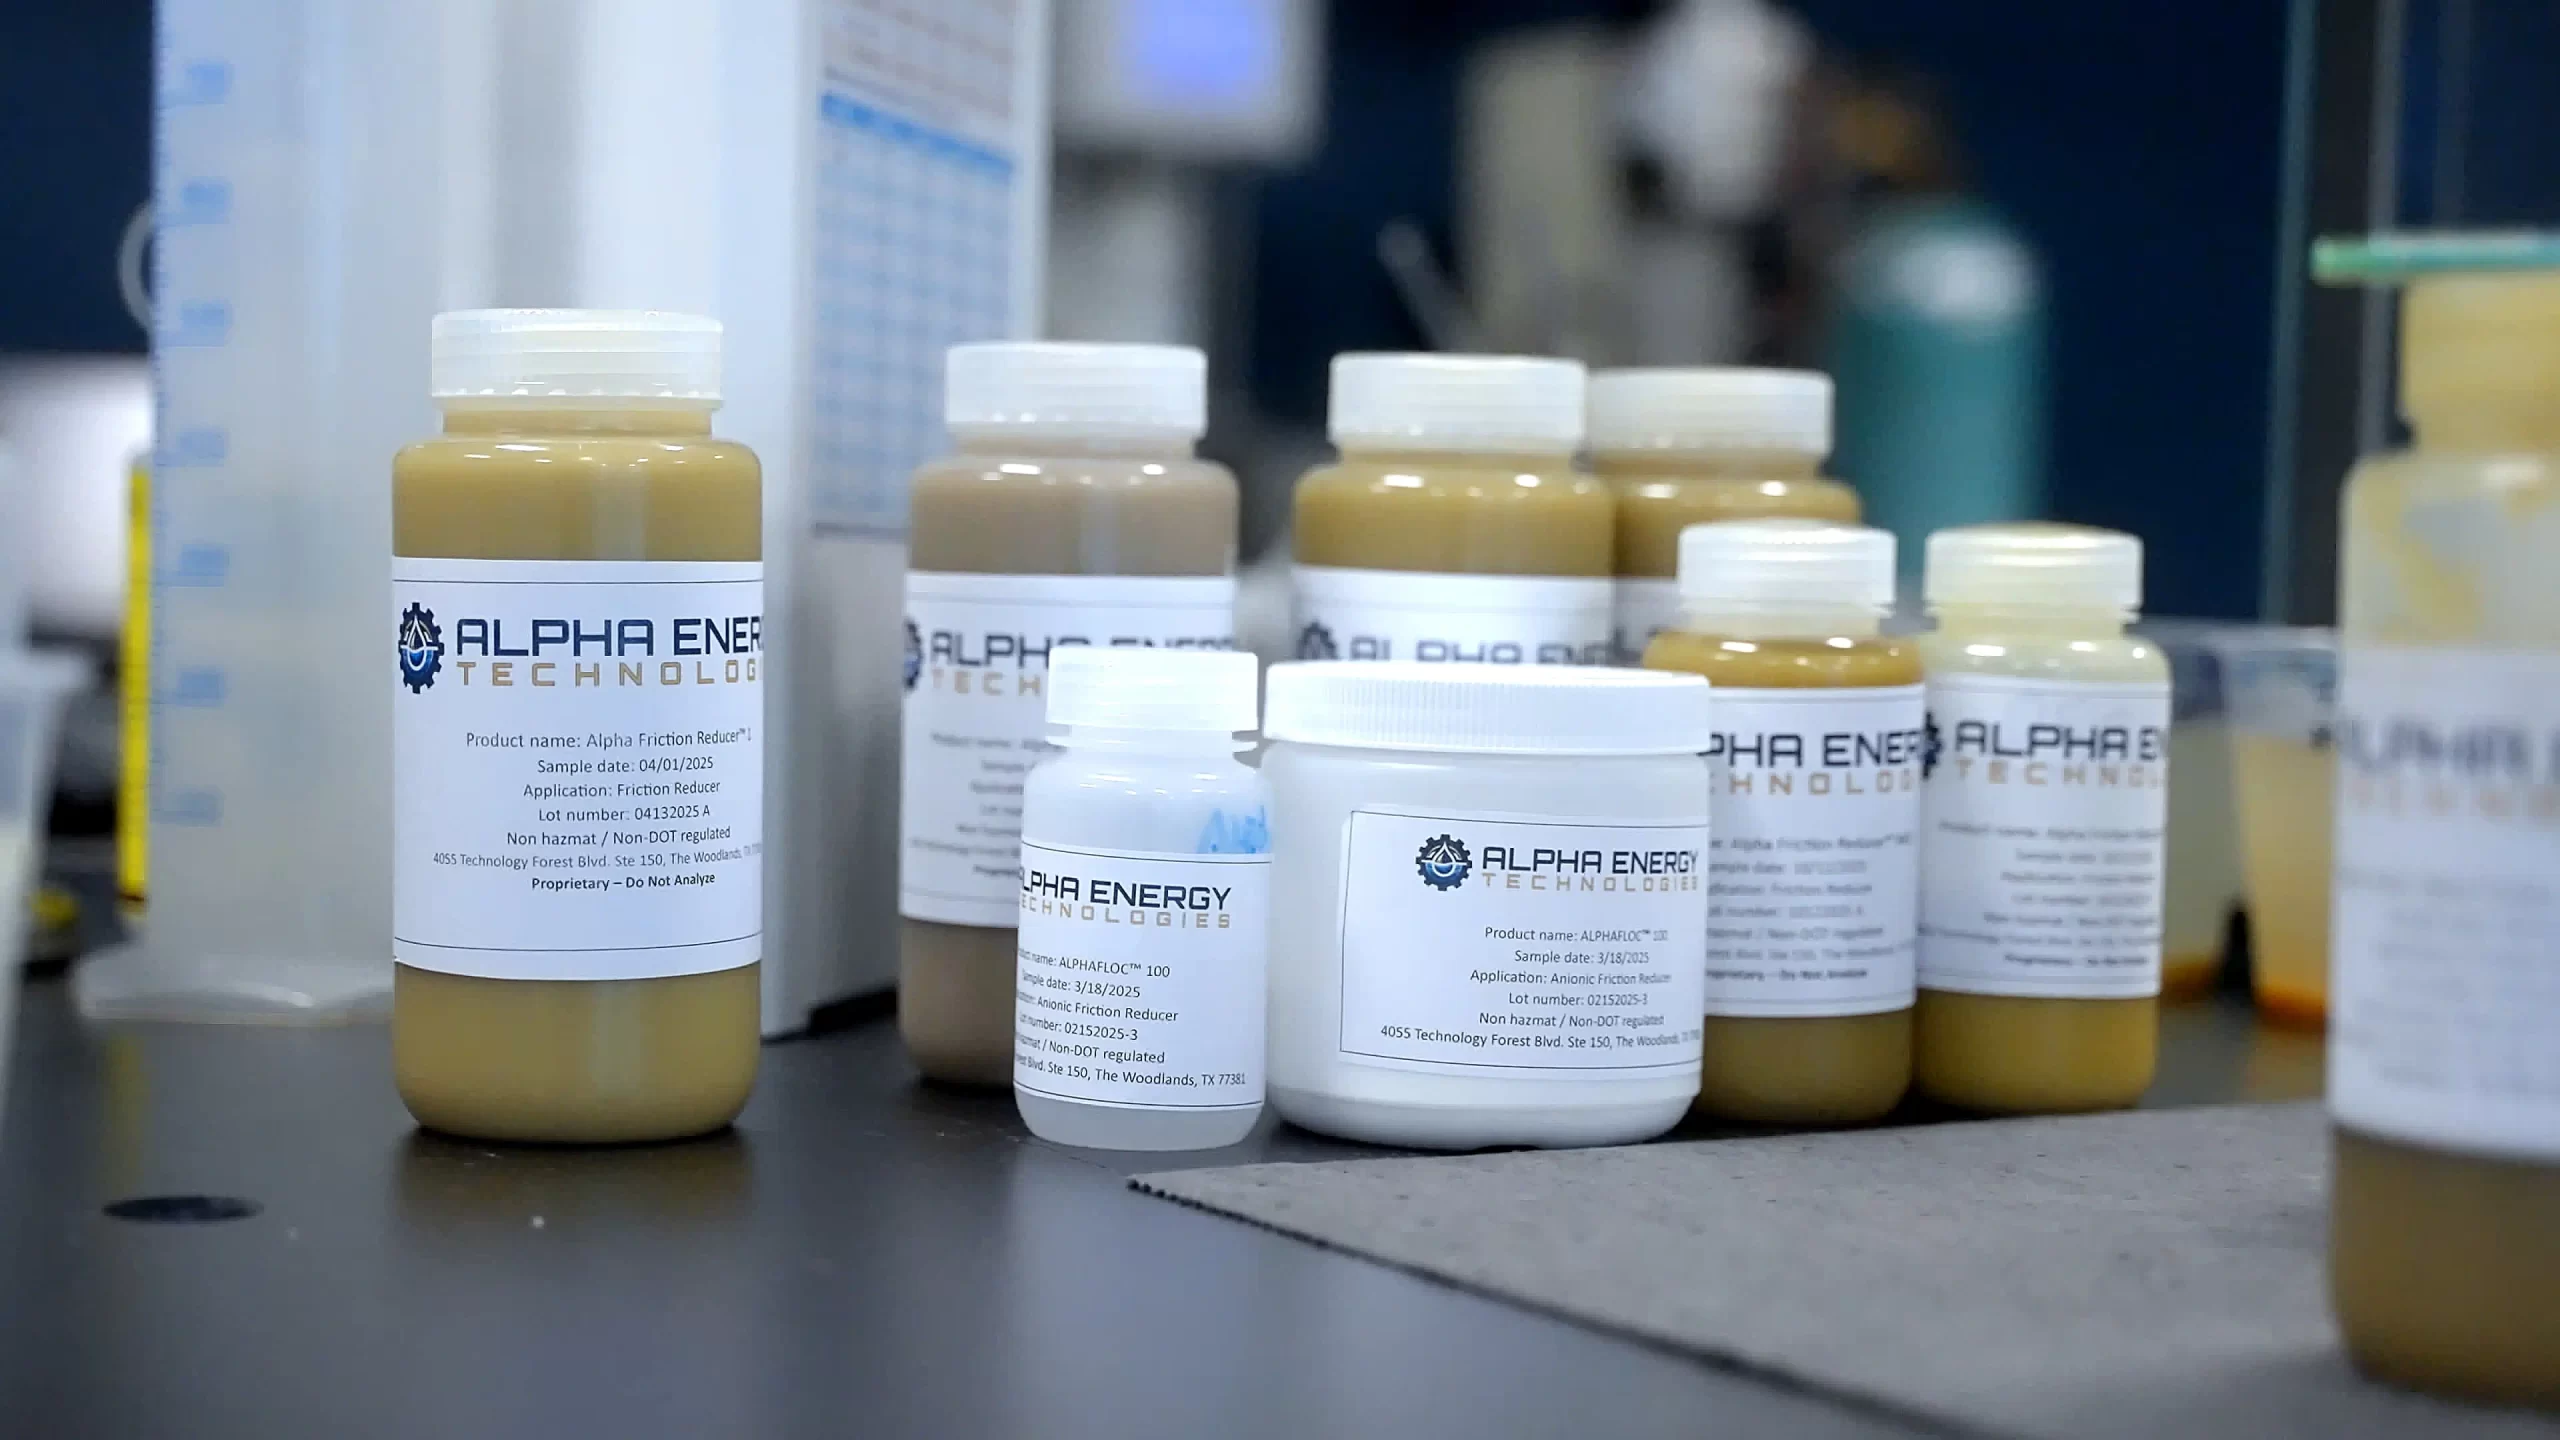
Tests were performed using several friction reducers which have given successful previous results in lab studies, and in products which have given superior results in full scale deployment in west Texas as well. In addition, two products (Alpha FR-1 modified and Alpha FR-4 modified) were modified after early indications that some optimization may give further improvements to the lab performance, and presumably field performance in the major operator frac operations.
Viscosity Testing
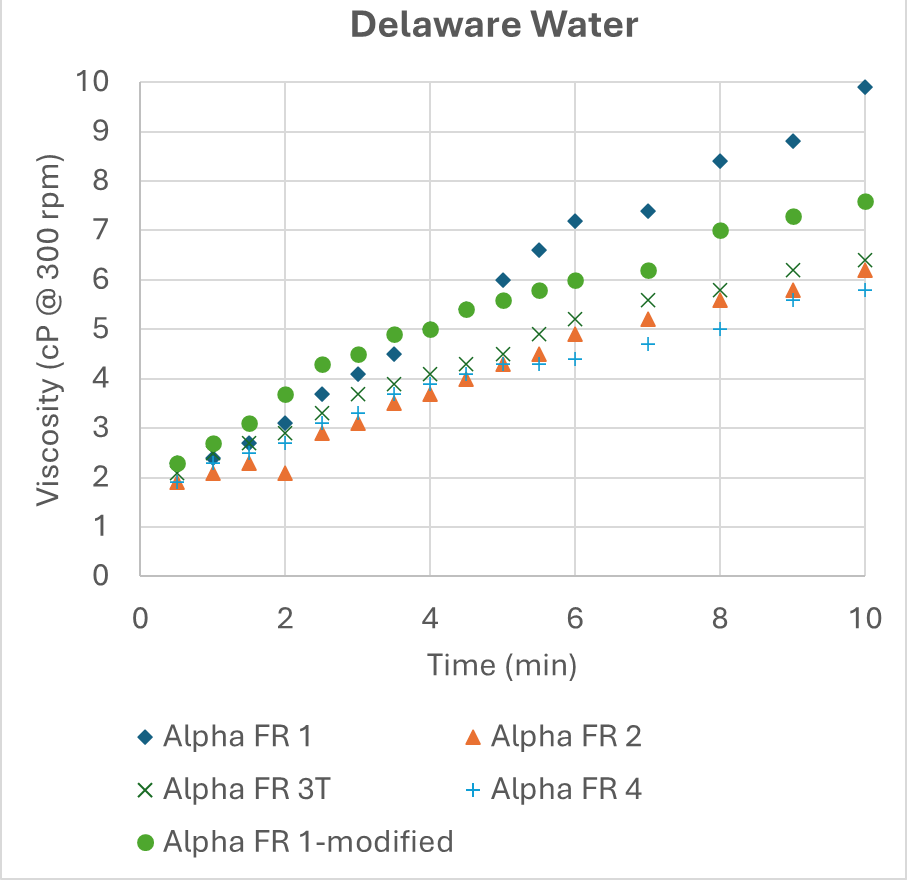
Figure 1. Viscosity development vs time, AET FRs. 2 GPT of FR was blended in synthetic produced a major operator Delaware water for 15 seconds at 600 rpm, then immediately measured at 300 sec⁻¹ using a Fann 35 equipped in an R1B1 configuration.
Dynamic viscosity testing is a relative performance test which gives indication on how rapidly the friction reducer inverts in a particular water, and a practical relative performance on the maximum viscosity and sand carrying capacity the different products would have in operations. The dosages tested are a matter of convenience, not a recommendation: the viscometer measurements are not significantly different below 2 GPT dosage.
Dynamic viscosity testing indicated that FR 1 is the best choice for fast inversion and viscosity development in this particular water source. FR 1 modified was close in performance.
Friction Loop Testing
Friction loop tests were conducted to determine viable candidates for the two water sources. These tests were run using the equipment and schedule described above. For ease of comparison, all FR products were added to the flow loop reservoir 2 minutes from the schedule initiation and added all at once.
Flow loop testing was conducted at a lower dosage of 0.5 gpt primarily to stress the friction reducer’s individual ability to perform in these waters. Similarly to the viscosity tests, this should not be used as an optimized indication of field and full deployment dosage, which will vary by well conditions, pump time, pump rate and sand schedule.
AET selected products that would work in varying amounts of produced water. FR 1, FR 3T, and FR 1-Modified are all FR products designed to handle varying amounts of produced water and are more than 50% more active than most emulsions used for this purpose. FR 2, FR 4, and FR 4-Modified also are designed to be able to handle a wide range of produced water, but are around 20% more active than most emulsion FRs.
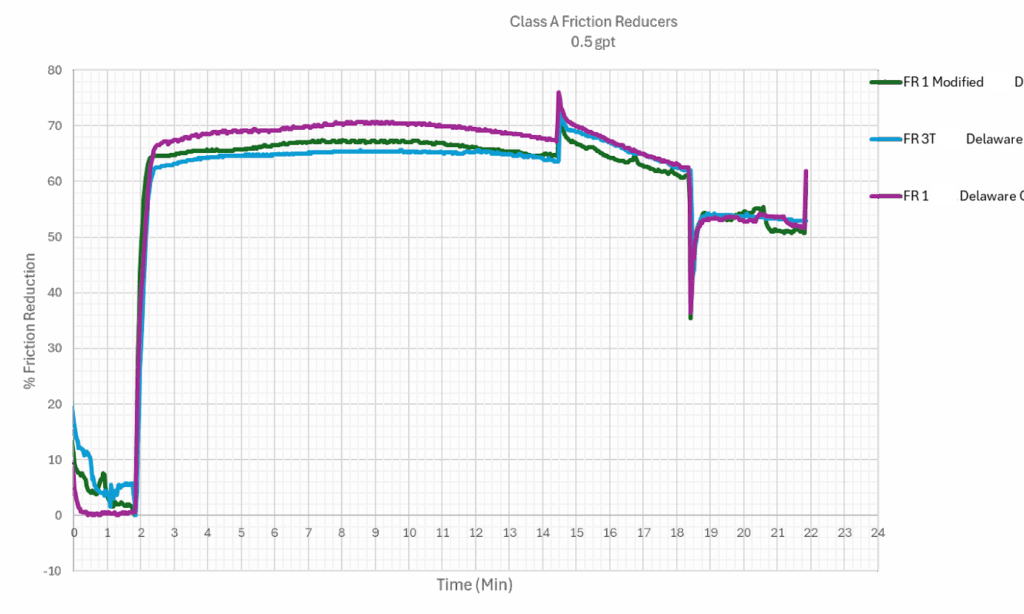
Figure 3. Higher concentration FRs tested via flow loop in synthetic Delaware basin waters via flow loop.
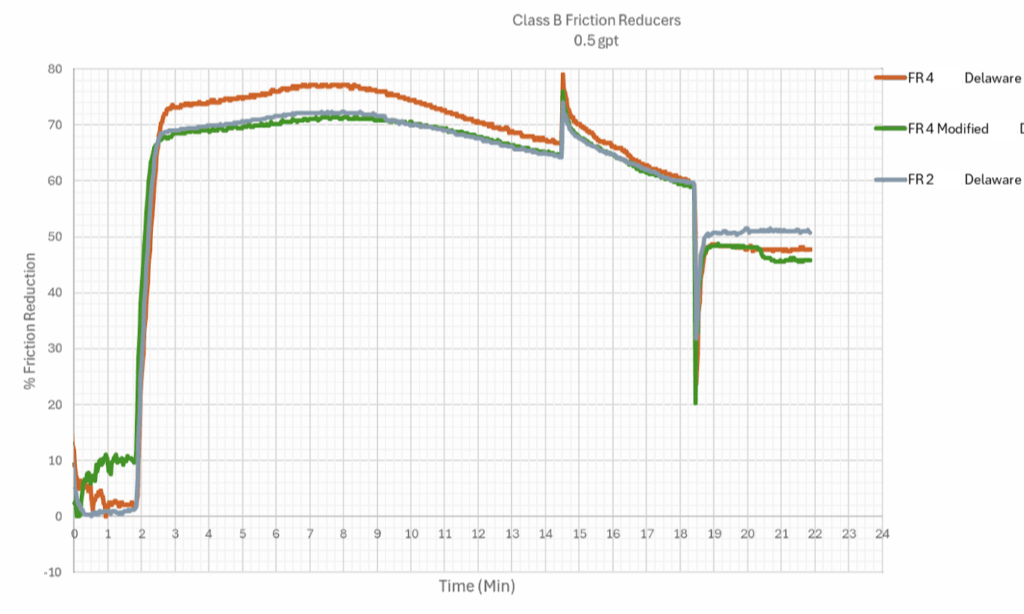
Figure 4. Moderate concentration FRs tested in Delaware basin water via flow loop.
The flow loop testing also indicates that FR 1 is the best performing product of these friction reducers in Delaware water sources for the higher concentration products, and that FR 4 gives the best performance for the moderate concentration products.
Conclusion
Testing for inversion speed, viscosity development and flow loop testing all indicate that Alpha FR 1 gives superior performance, with Alpha FR 1 modified following closely on viscosity tests but falling behind on flow loop testing. AET modified two products to test if further optimization could be achieved beyond the standard product line given early test results, however both did not give better results than the FR 1.