Executive Summary
AET tested both 6T and 7A in both water sources and found that 7A outperformed for both water sources. We tested multiple dosages for both 7A and 6T and found in the testing for 0.6 gpt of 7A in the crew 1 water source and 0.75 gpt in the crew 2 water source to give the highest non-degrading friction reduction through both steady-state and shear ramp sweeps. We also developed viscosity data in the different water sources, and derived power law parameters n and K. Attached for convenience is the water makeup which we reconstructed in the lab for testing.
Correspondence
The client communicated to AET the water analyses for two New Mexico-based water analyses from samples for the two crews operating from a major.
Chain of Custody
No samples were transferred between parties during these studies.
Test Procedures
Synthetic Brine Composition
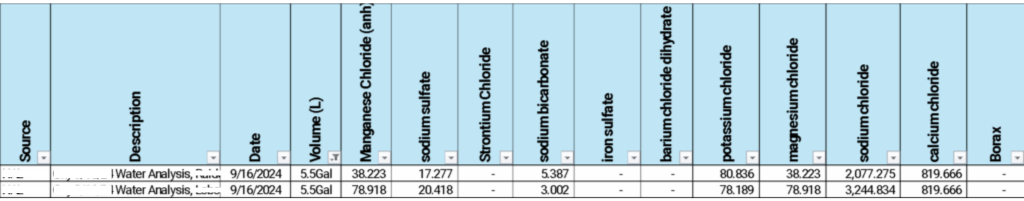
A synthetic water makeup matching the customer’s correspondence was generated matching Table 1 below for the Delaware water source.
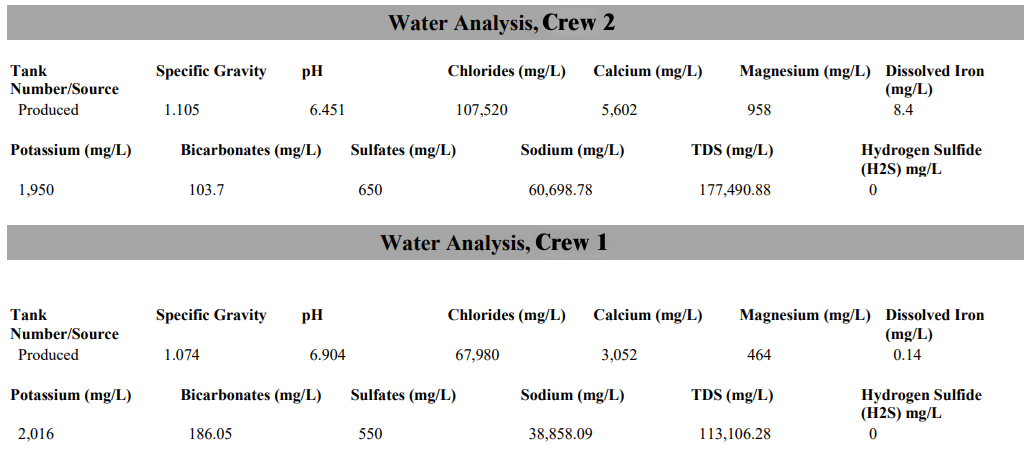
Table 1. Major operator water quality averages from recent jobs, supplied by another major operator.
Exact masses below (g) were added to 5.5 gal of Houston tap water as follows, and allowed to dissolve and flow through a Chandler 7700 friction loop for 10 minutes at a rate of 2 gpm, when the solution appeared reasonably homogenous:
Flow Loop Tests
A Chandler 7700 flow loop equipped with both a ¾” and ½” 40 ft pipe with pressure sensors was used to determine friction reduction during pumping. A flow regime which incorporates several rate changes was included in the testing to determine shear sensitivity of the individual products at different rates. Below is an image of the flow loop used in testing, and a screenshot of the rate schedule.

Figure 1. Rate schedule used for standard flow loop testing.
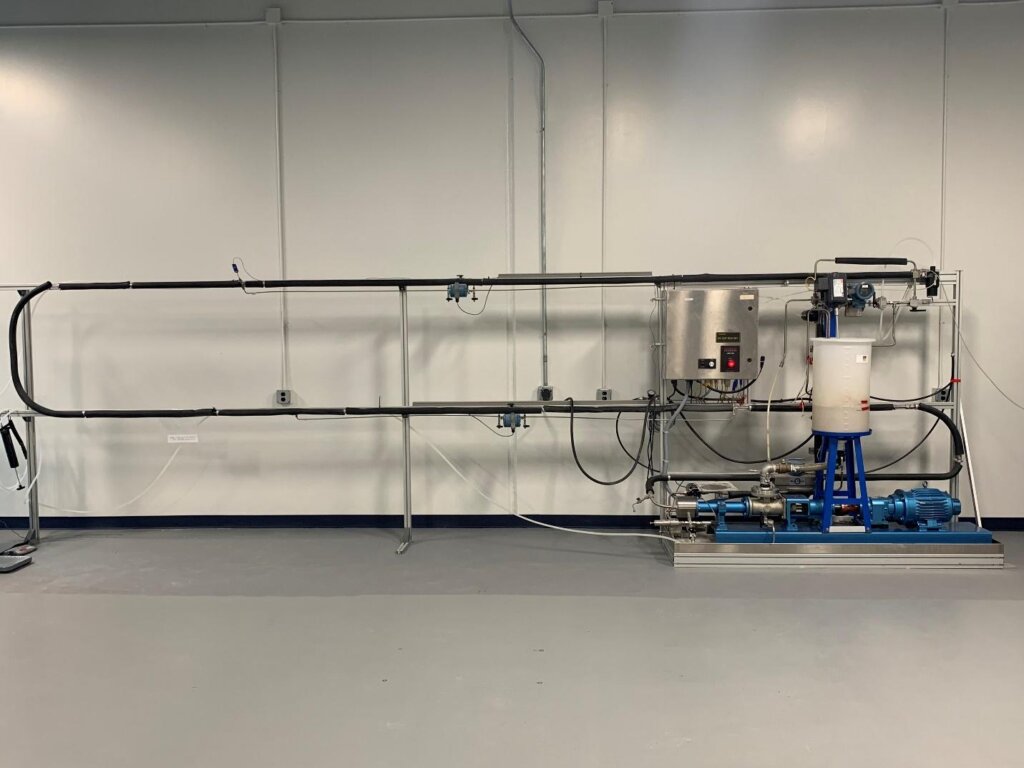
Figure 2. Flow loop used for this testing.
For each individual test, the schedule is started and allowed to achieve a steady base rate without friction reducer product and the appropriate amount of friction reducer product is added to the reservoir at once via syringe, fully dosed in less than 3 seconds. The change in pressure is monitored electronically over the course of the test and calculated to % friction reduction using the Darcy-Weisbach equation for head loss.
Cleaning the flow loop after and between tests is done by combinations of serial dilution and draining followed using sodium perborate (between 5 and 10 grams per test) to oxidatively cleave any residual friction reducer, a process taking around an hour per test.
Dynamic Viscosity Testing
Viscosity testing was conducted with a Grace M3600 viscometer equipped with an R1B1 bob. A timer was started followed by samples added at appropriate dosages (0.4 mL for 2 gpt) in 200 mL of synthetic water (produced from the recipe above in 2L batches). These were blended at approximately 800 rpm for 15 seconds and then measured under continuous shear of 511 sec⁻¹ on the viscometer with timed measurements as indicated in the results.
Test Results
Tests were performed using 7A which has given successful previous results in lab studies, and in products which have given superior results in full scale deployment in West Texas as well.
Viscosity Testing
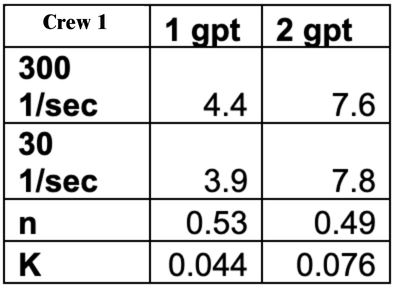
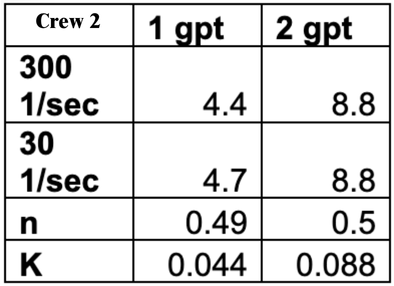
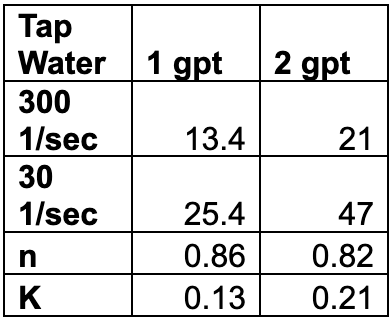
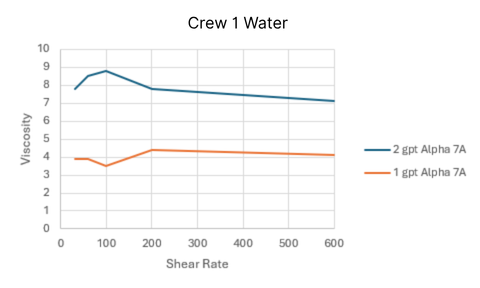
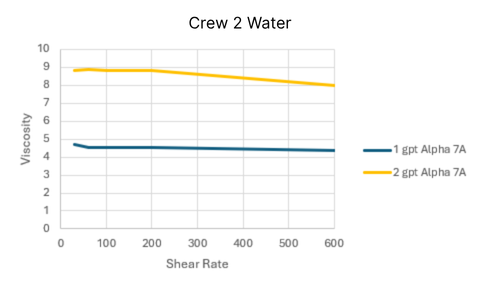
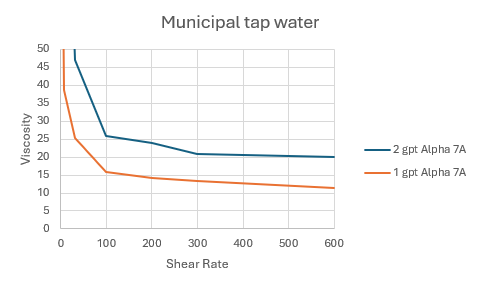
Figure 1. Viscosity development vs time, AET FRs.
2 GPT of FR was blended in synthetic produced water for 15 seconds at 600 rpm, then immediately measured at 300 sec⁻¹ using a Fann 35 equipped in an R1B1 configuration. Houston tap water tests are also displayed to demonstrate 7A in lower TDS loading.
Power law values n and K were derived using the standard equations for drilling muds, and as expected varied on concentrations and on water quality.
Friction Loop Testing
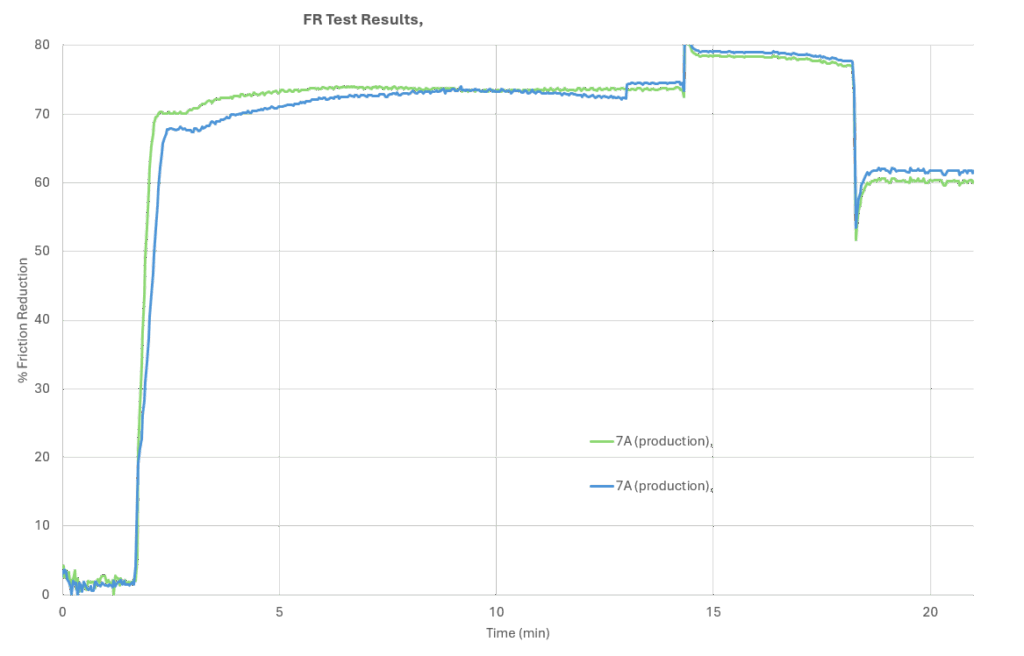
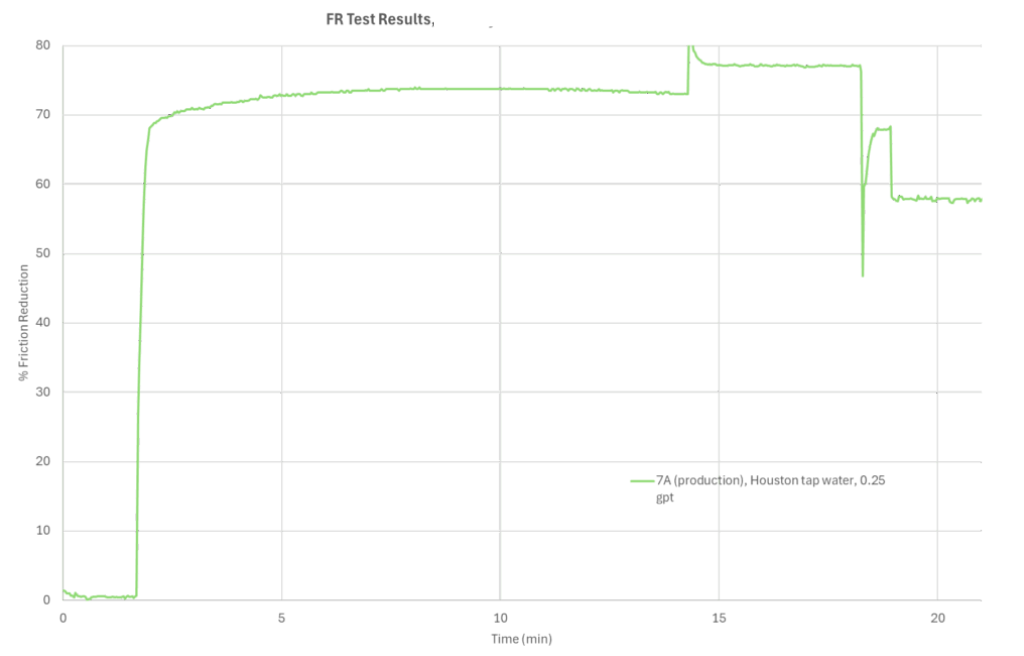
Figure 2a. Comparative flow loop testing using 0.6 gpt and 0.75 gpt of FR in synthetic major operator Delaware water.
Figure 2b. Flow loop testing using 0.25 gpt in Houston municipal water for comparison.
AET tested both 6T and 7A in both water sources, and found that 7A outperformed for both water sources. We tested multiple dosages for both 7A and 6T, and found in the testing for 0.6 gpt of 7A in the crew 1 water source and 0.75 gpt in the crew 2 water source to give the highest non-degrading friction reduction through both steady-state and shear ramp sweeps. We also verified that production batches and lab batches matched in performance as part of a standard QA/QC test, which overlayed with the full test in these waters as well (not shown). We performed similar viscosity testing, allowing us to derive both n and K values used in most frac modeling software which includes fluid parameter inputs. Similarly to the viscosity tests, this should not be used as an optimized indication of field and full deployment dosage, which will vary by well conditions, pump time, pump rate and sand schedule.