Executive Summary
AET tested both 6T and 7A in a representative sample from a major engineering firm and found that 6T outperformed in all water dilutions except 10% produced / fresh, where the differences were indistinguishable even at very low loading. We tested multiple dosages for both 7A and 6T and found in the testing a stable flow loop result occurred at 0.25 gpt for both 6T and 7A, but slight differences in degradation performance after 12 minutes could account for a small difference in how they would likely perform in the field: 12 minutes is longer than the average pipe time, but given the scaling challenges of directly relating flow loop data to field data, 6T should outperform 7A. We also developed viscosity data in the different water sources, and derived power law parameters n and K. Attached for convenience is the water makeup which we reconstructed in the lab for testing.
Compositionally, FR 3T is analogous and lower activity than 6T, and FR 4 is analogous and lower activity than 7A, and could also be considered if operating at lower friction reducer concentrations is not operationally feasible.
Correspondence
The client communicated to AET the water analyses for two water analyses deemed representative of produced and fresh water, respectively, on 2/24/2025.
Chain of Custody
No samples were transferred between parties during these studies.
Test Procedures
Synthetic Brine Composition
A synthetic water makeup matching the customer’s correspondence was generated matching Table 1 below for the produced water source.
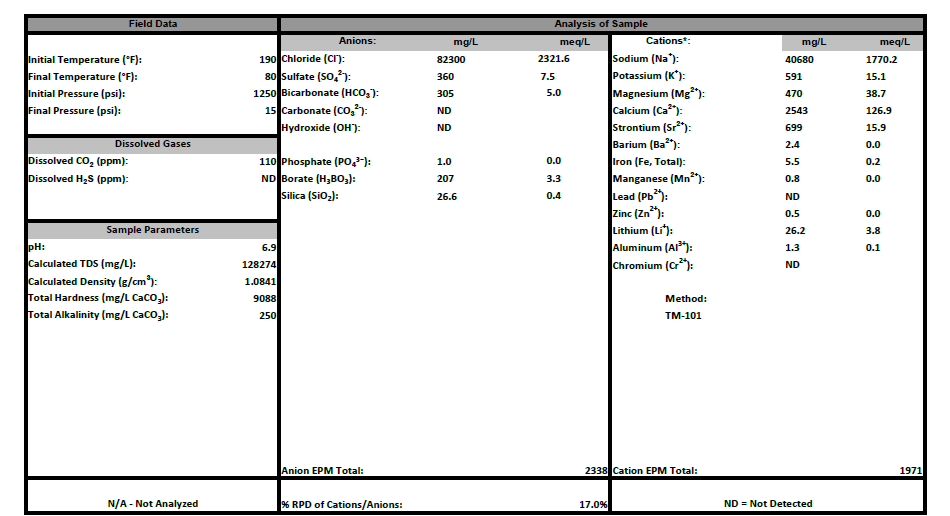
Table 1. Water quality for produced water, supplied by a major engineering firm
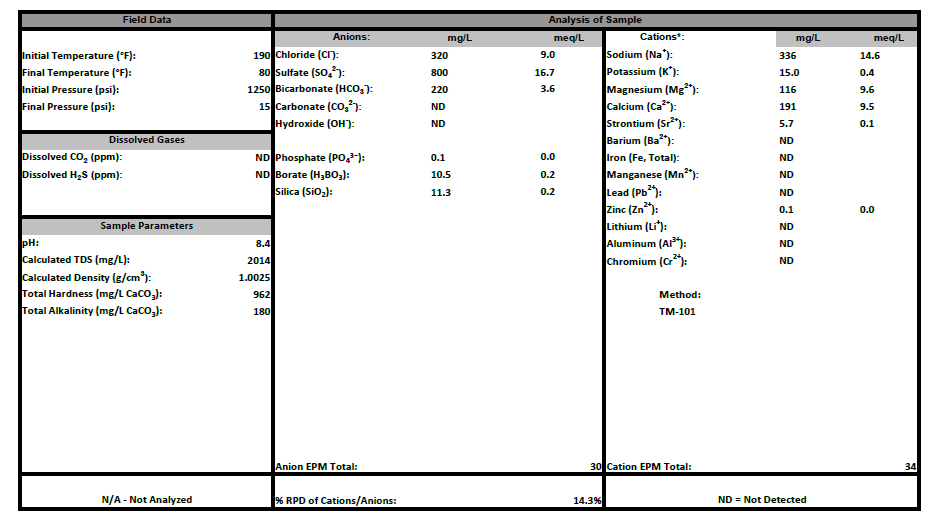
Table 2. Fresh water analysis, supplied by major engineering firm
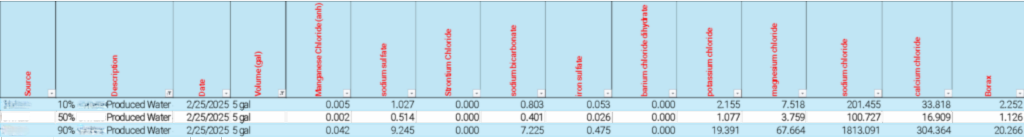
Synthetic Brine Makeup: 90%, 50%, 10% Produced / Fresh
Exact masses below (g) were added to 5.0 gal of Houston tap water as follows, and allowed to dissolve and flow through a Chandler 7700 friction loop for 10 minutes at a rate of 2 gpm, when the solution appeared reasonably homogenous:
Flow Loop Tests
A Chandler 7700 flow loop equipped with both a ¾” and ½” 40 ft pipe with pressure sensors was used to determine friction reduction during pumping. A flow regime which incorporates several rate changes was included in the testing to determine shear sensitivity of the individual products at different rates. Below is an image of the flow loop used in testing, and a screenshot of the rate schedule.

Figure 1. Rate schedule used for standard flow loop testing.
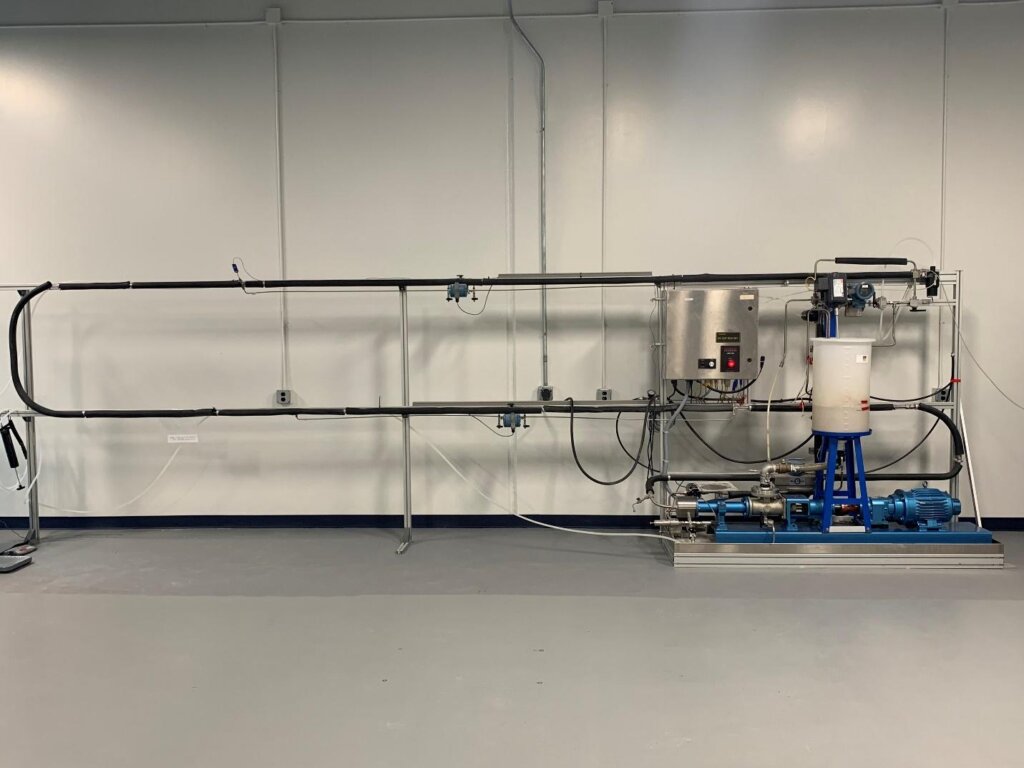
Figure 2. Flow loop used for this testing.
For each individual test, the schedule is started and allowed to achieve a steady base rate without friction reducer product and the appropriate amount of friction reducer product is added to the reservoir at once via syringe, fully dosed in less than 3 seconds. The change in pressure is monitored electronically over the course of the test and calculated to % friction reduction using the Darcy-Weisbach equation for head loss.
Cleaning the flow loop after and between tests is done by combinations of serial dilution and draining followed using sodium perborate (between 5 and 10 grams per test) to oxidatively cleave any residual friction reducer, a process taking around an hour per test.
Dynamic Viscosity Testing
Viscosity testing was conducted with a Grace M3600 viscometer equipped with an R1B1 bob. A timer was started followed by samples added at appropriate dosages (0.4 mL for 2 gpt) in 200 mL of synthetic water (produced from the recipe above in 2L batches). These were blended at approximately 800 rpm for 15 seconds and then measured under continuous shear of 511 sec⁻¹ on the viscometer with timed measurements as indicated in the results.
Test Results
Tests were performed using 6T and 7A which has given successful previous results in lab studies, and in products which have given superior results in full scale deployment in West Texas. Tests were performed in 90% produced and 10% produced synthetic waters using concentrations reasonable for field implementation. Viscosity reduction in produced water is common for all FRs. In these waters, the differences between 6T and 7A are subtle, with 6T slightly ahead.
Viscosity Testing
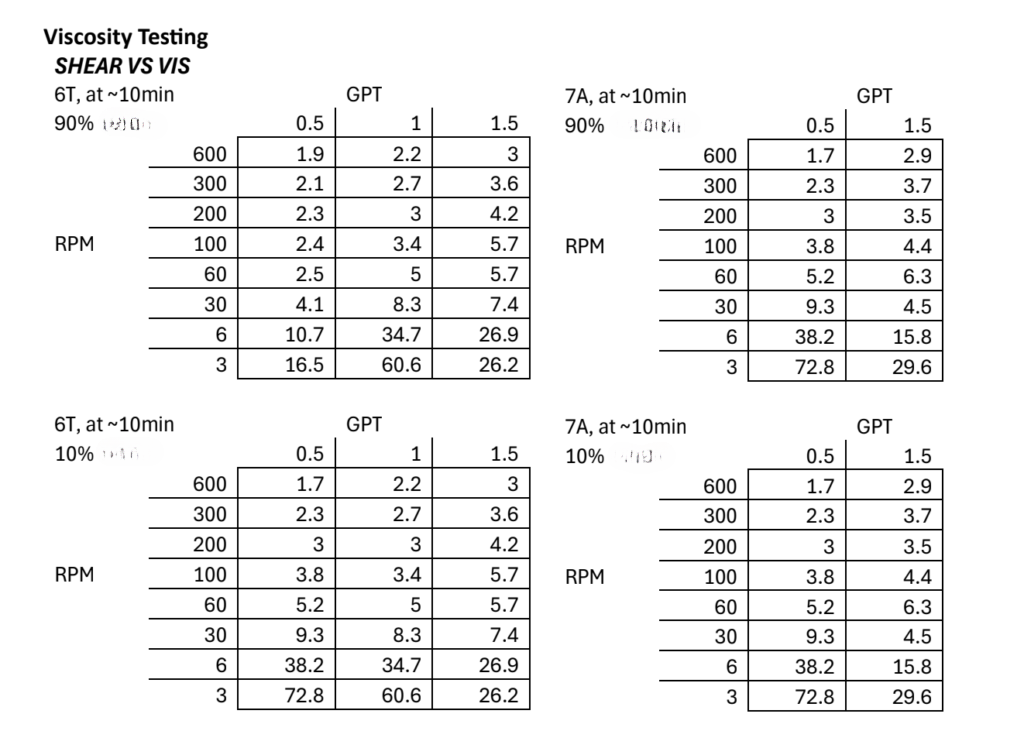
Note: viscosity measurements at low loading are not reliable for <30 rpm on this instrument.
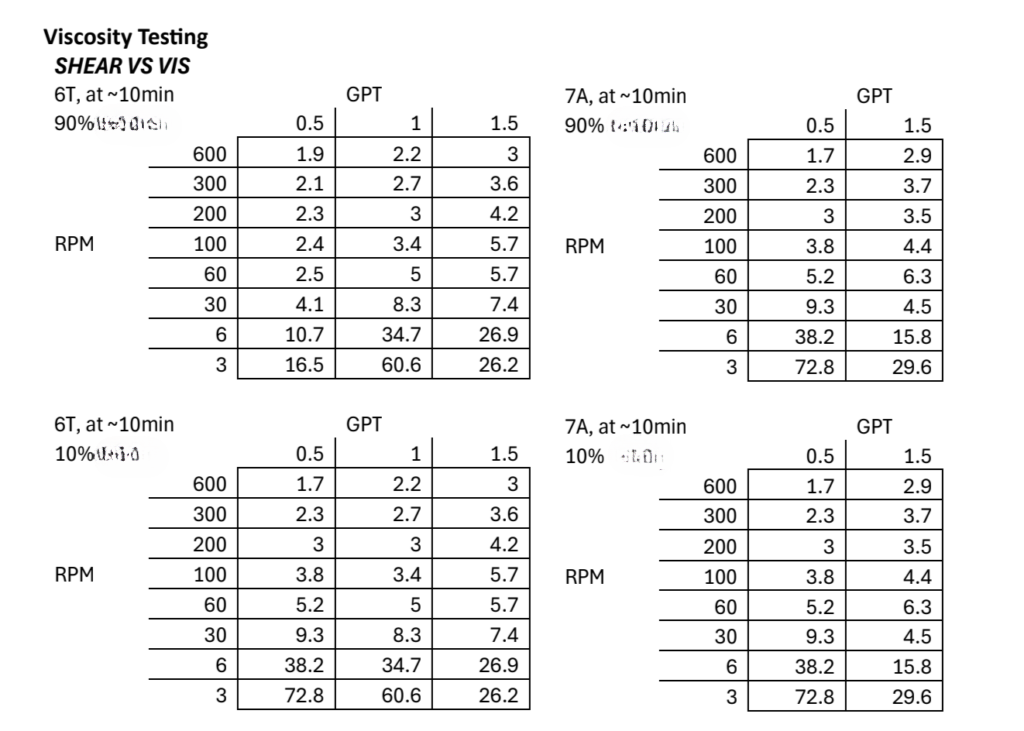
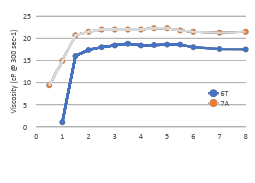
Figure 3. Comparative Testing for 6T and 7A in municipal (Houston) tap water at 2.0 gpt. 7A normally outperforms when multivalent ions are very low or not present: not so in major engineering firm water sources.
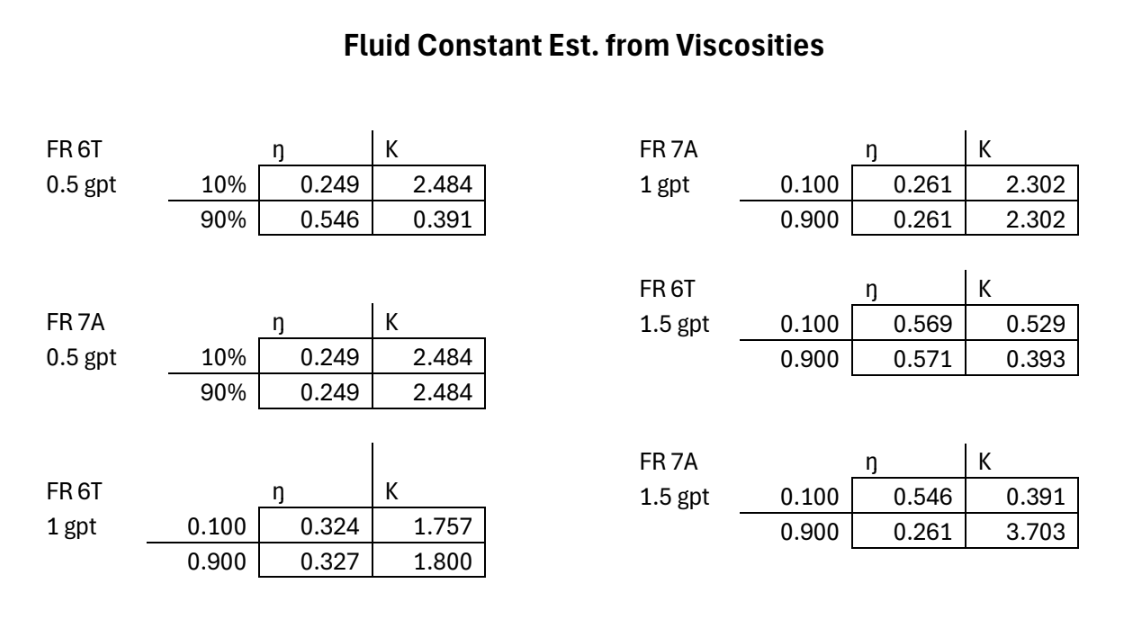
Fluid Parameters
Power law values ŋ and K were derived using the standard equations for drilling muds.
Friction Loop Testing
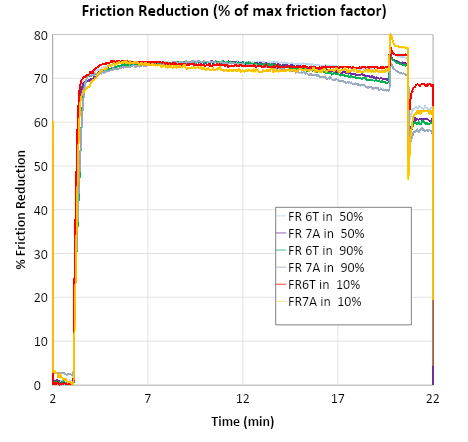
Figure 2a. Comparative flow loop testing using 0.25 gpt of FR 6T and 0.25 gpt of FR 7A in synthetic major engineering firm’s water, mixed at 10%, 50%, and 90% ratios. The fast inversion time and non-degrading tail are desired outcomes.
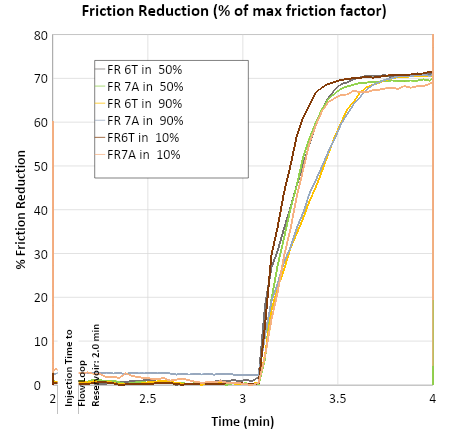
Figure 2b. Blow-up for the relative hydration rates for the first 2 minutes; 2c) and relative performance when some degradation can start to be observed. Faster Inversion is desired: 6T reaches 85% maximum inversion in 12 seconds in 10% Produced water.
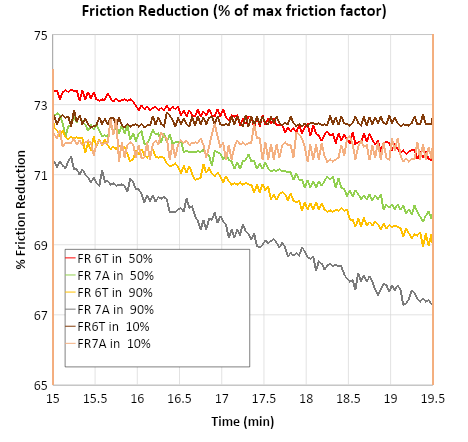
Figure 2c. Relative performance when some degradation can start to be observed.
AET tested both 6T and 7A in both 10% produced and 90% produced water sources, and found that 6T outperformed both the 50% and 90% water sources, and was very close to the same performance in 10% water. Given the disconnect on scaling between flow loop we recommend a higher initial setpoint during toe stages (0.5–0.6 gpt), and tapering back toward the middle (0.3–0.5 when the full job does not have an issue: 0.45 gpt has been a reliable setpoint for these products in multiple frac jobs. Similarly to the viscosity tests, this should not be used as an optimized indication of field and full deployment dosage, which will vary by well conditions, pump time, pump rate and sand schedule.
Disclaimer
THIS ANALYSIS AND RECOMMENDATION REPORT (the “REPORT”) IS INTENDED SOLELY FOR GENERAL GUIDANCE AND INFORMATION PURPOSES. THE CONTENT OF THIS REPORT IS BASED SOLELY ON THE OPINION OF ALPHA ENERGY TECHNOLOGIES LLC AND ITS LIMITED KNOWLEDGE OF IN-FIELD OR DOWN HOLE CONDITIONS THAT MAY AFFECT THE OUTCOMES IMPLIED BY THIS REPORT. THIS REPORT SHOULD NOT BE REGARDED AS AN OBJECTIVE OR INDEPENDENT ANALYSIS OF THE WATER SAMPLES CONTAINED HEREIN, AND IT IS NOT PREPARED IN ACCORDANCE WITH ANY QUALITY CONTROL STANDARDS. ALPHA ENERGY TECHNOLOGIES LLC IS NOT RESPONSIBLE OR LIABLE FOR THE USE OR INTERPRETATION OF THE INFORMATION CONTAINED IN THIS REPORT. TO THE MAXIMUM EXTENT PERMITTED BY LAW, ALPHA ENERGY TECHNOLOGIES LLC EXPRESSLY DISCLAIMS ALL CONDITIONS, WARRANTIES AND REPRESENTATIONS OF ANY KIND, WHETHER EXPRESS, IMPLIED OR STATUTORY REGARDING THIS REPORT AND ITS CONTENT, INCLUDING WARRANTIES OF NON-INFRINGEMENT, MERCHANTABILITY, SATISFACTORY QUALITY AND FITNESS FOR PURPOSE. NOTWITHSTANDING THE FOREGOING, ALPHA ENERGY TECHNOLOGIES LLC MAKES NO WARRANTY THAT THE INFORMATION CONTAINED IN THIS REPORT WILL MEET THE REQUIREMENTS OF THE RECIPIENT OF THIS REPORT OR THAT THE RESULTS AND RECOMMENDATIONS OF THIS REPORT ARE INDICATIVE OF, OR CONSISTENT WITH, FUTURE OUTCOMES USING ANY PRODUCT PROVIDED BY ALPHA ENERGY TECHNOLOGIES LLC.